
Products
In ACM, we believe that opening and sharing data is a powerful — and often essential — way to advance science and technology. It is also a commitment we have long held. You are welcome to use our data, algorithms and models. Please note the following terms of use:
- For research and/or education purposes, references are required if you use them — please cite the relevant references listed in the description of each product below. Co-authorship is not required, unless otherwise stated for some specific products.
- For commercial, for-profit or other non-research and non-education purposes, prior permission from the group leader is required.
- For any purposes, permission is required to re-distribute the products.
- We are not responsible for any errors or imperfections in, or misuse of, the products.
- We look forward to any feedback to further improve the products.
For permission requests and feedback, please contact the group leader, Prof. Jintai Lin (linjt@pku.edu.cn). Downloading the data requires a brief one-time registration: clicking a download link opens the registration form, and the download starts automatically once you have registered.
Distribution of registered users
Geographic distribution of registered data users around the world, colored by data product (use the layer control at the top-right corner to switch base maps). The number on a dot is the number of registered accounts at that place: zooming out merges users of the same country or province into one dot, zooming in splits them down to prefecture, county and institute level, so that dots never pile up. An account registered for several products is counted once per product, so the same place may show up in more than one colour. Tick the boxes in the legend to show only the products you select.
- Registered users
- 766
- Institutions
- 337
- Countries / regions
- 17
Data as of (+08:00)
The map shows anonymized city-level locations. Each dot is placed by the institution you registered with; an IP-based location is used only where the institution cannot be placed. Zoom in and each dot also names the institution(s) that registered from that place. Registrations without a resolvable location are not plotted but are still counted in the statistics below. Some registered accounts may have been lost during the migration to this new website. No names or e-mail addresses appear anywhere on the map. Scroll-wheel zoom is disabled so that page scrolling is not intercepted.
Users by product
Statistics table: all products.
| Product | Registered users | Institutions | Countries / regions | Registration dates |
|---|---|---|---|---|
| POMINO-OMI NO2 | 512 | 237 | 10 | – |
| POMINO-TROPOMI NO2 | 382 | 196 | 14 | – |
| Global-POMINO-TROPOMI | 1 | 1 | 1 | – |
| POMINO-GEMS NO2 | 67 | 48 | 11 | – |
| Natural Emission | 225 | 130 | 10 | – |
| PHLET-OMI NOx Emission | 0 | — | — | — |
| PM2.5 Observations | 0 | — | — | — |
| Visibility AOD | 166 | 106 | 8 | – |
| EOF-EEMD | 141 | 95 | 9 | – |
| PKUCPL | 133 | 91 | 8 | – |
| Total (deduplicated) | 766 | 337 | 17 | — |
Per-product statistics come from the registration records, counted by account (one e-mail counts once) in the same order as the products on this page; institutions and countries are the most recent entry for each account. The total row counts each account, institution and country once for the selected products — an account registered for several products is not counted twice. Registration dates are Beijing time (UTC+8). PHLET-OMI NOx Emission and PM2.5 Observations have no registrations yet (—).
POMINO-OMI: Tropospheric NO2 over Asia retrieved from OMI
Introduction
Algorithm
POMINO-OMI v1 (Lin et al., 2014; Lin et al., 2015):
POMINO-OMI v2 (Liu et al., 2019):
POMINO-OMI v2.1 (Zhang et al., 2022):
Validation
AMFv6 Code
- Turn on/off explicit treatment of aerosol optical effects, or revise aerosol info using measurements
- Choose from a variety of surface reflectance data (currently OMI, MODIS black-sky, MODIS blue-sky, MODIS BRDF)
- Turn on/off dynamic atmosphere (e.g., time-varying air temperature, pressure profile, etc.)
- Retrieve clouds online, or read cloud data from a third party
- Read surface pressure measurement instead of using the one from model met field
- Output AMFv6 results in either ascii, binary or netcdf format
- Produce/use a look-up table (if desired in some cases)
POMINO-OMI v1 product
Level-3 data
Level-2 data
POMINO-OMI v2 product
Level-3 data
Level-2 data
POMINO-OMI v2.1 product
Level-2 data
References
POMINO-TROPOMI: Tropospheric NO2 over Asia retrieved from TROPOMI
Introduction
Algorithm
POMINO-TROPOMI v1 (Liu et al., 2020):
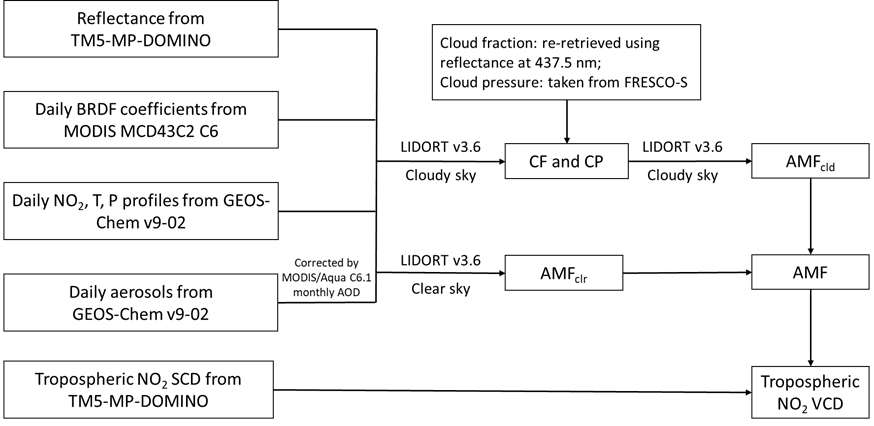
POMINO-TROPOMI v1.2:
POMINO-TROPOMI v1.2.2:
POMINO-TROPOMI v2:
- We calculate optical depth (OD) vertical profiles of sulfate-nitrate-ammonia (SNA), black carbon (BC), organic carbon (OC), dust and sea salt aerosols using volume mixing ratio profiles provided by NASA Global Earth Observing System Composition Forecast (GEOS-CF v1.0) dataset, and aerosol optical properties from Hi_Spectral_Res_Files.v9-02 from GEOS-Chem wiki page.
- We also take other ancillary parameters including surface pressure, tropopause, temperature profile, relative humidity profile and a priori NO2 profiles from GEOS-CF v1.0 dataset for tropospheric NO2 AMF calculation.
POMINO-TROPOMI v2.1:
Recommendation for data use:
v1.2: 01 May 2018 – 31 December 2020
v1.2.2: 01 January 2021 – 31 December 2022 (same as v1.2 for 01 May 2018 – 31 December 2020)
v2: 01 January 2023 – 31 December 2023
v2.1: 01 January 2020 – TBD
POMINO-TROPOMI v1.2 product
Level-3 data
Level-2 data
POMINO-TROPOMI v1.2.2 product
Level-2 data
POMINO-TROPOMI v2 product
Level-3 data
Level-2 data
POMINO-TROPOMI v2.1 product
Level-3 data
Level-2 data
References
Global-POMINO-TROPOMI: Retrieval of tropospheric HCHO and NO2 with improved consistency
Introduction
Algorithm
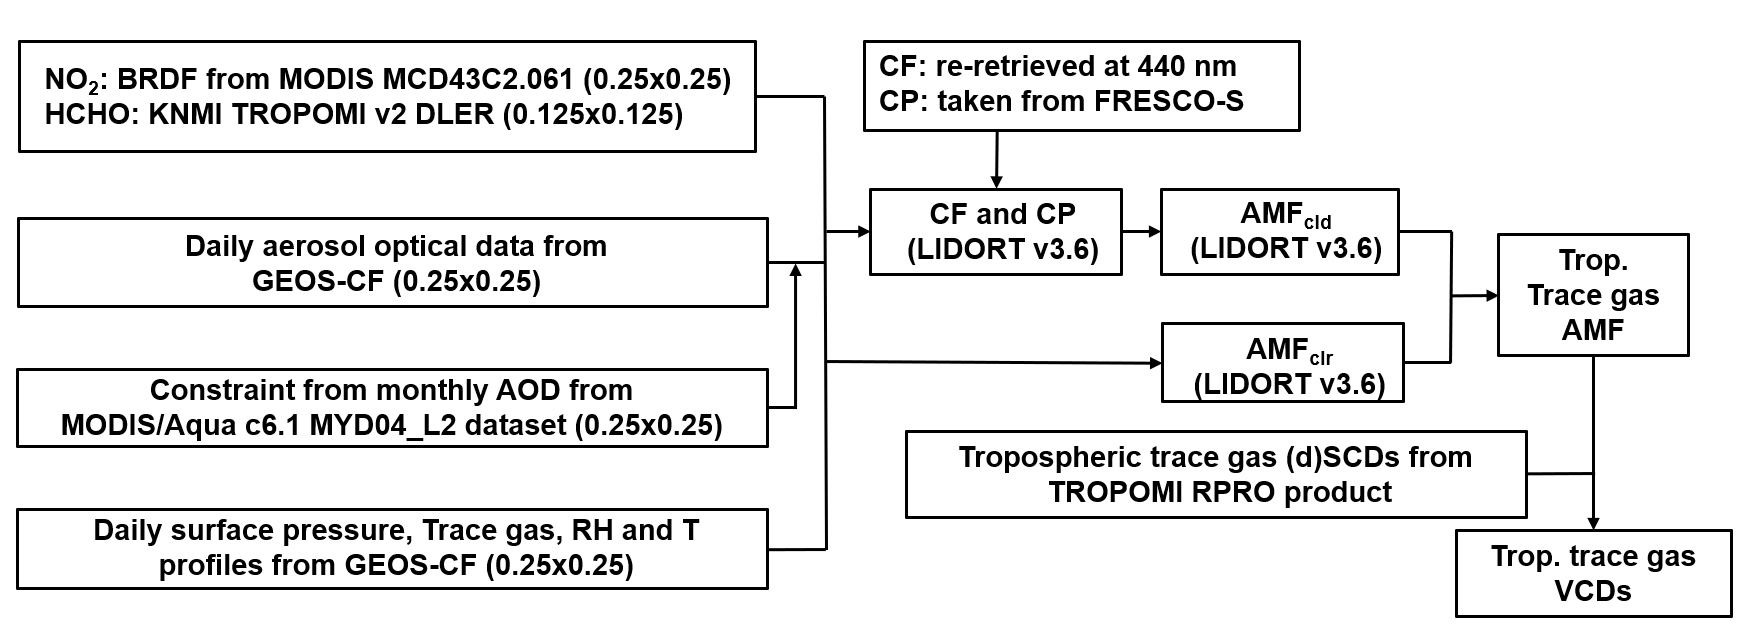
Global POMINO-TROPOMI retrieval dataset
Level-3 data
Level-2 data
References
POMINO-GEMS: Tropospheric NO2 over Asia retrieved from GEMS
Introduction
Algorithm
POMINO-GEMS v1 (Zhang et al., 2023):
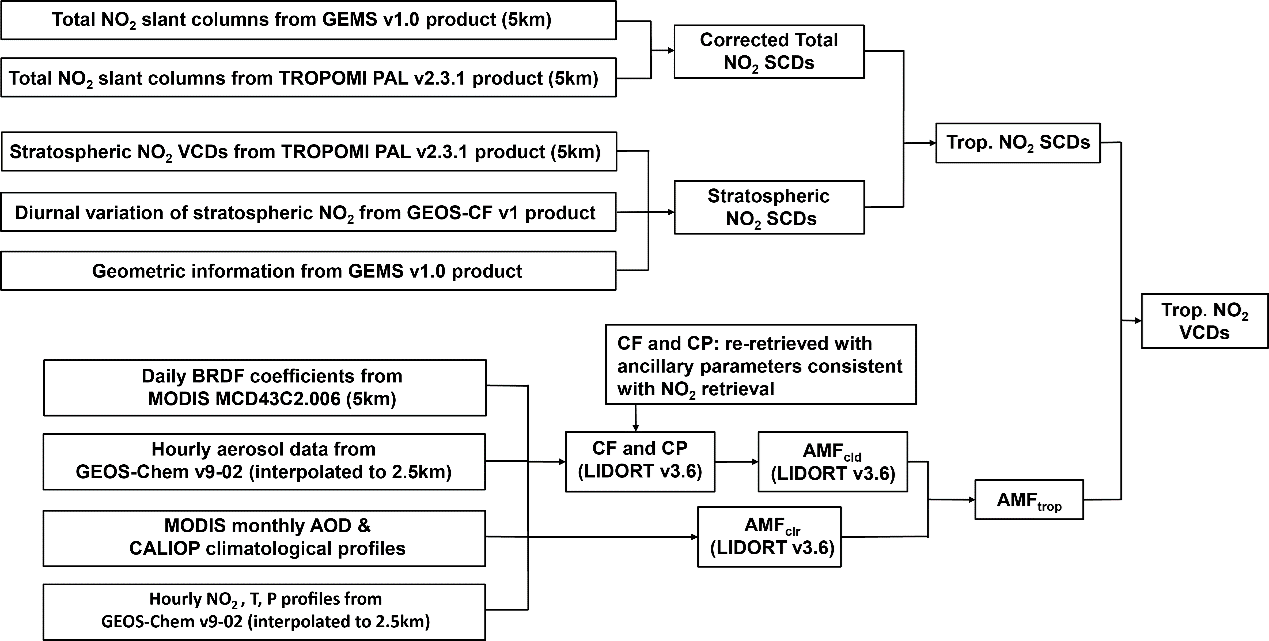
POMINO-GEMS v1.0.1:
POMINO-GEMS v1 product
Level-2 data
POMINO-GEMS v1.0.1 product
Level-3 data
Level-2 data
References
Global high-resolution natural emissions
Introduction
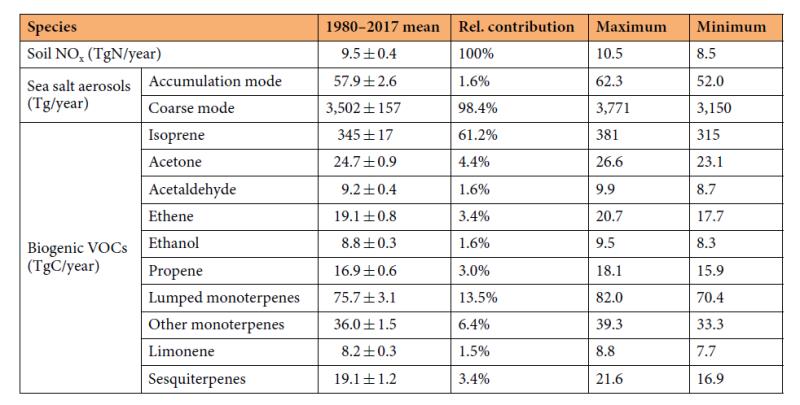
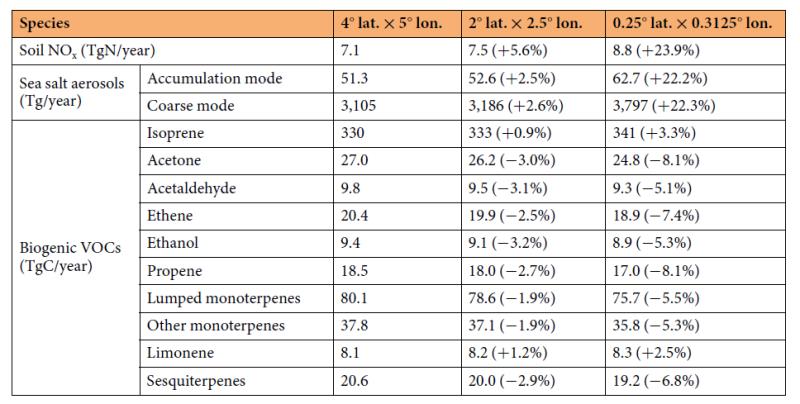
Soil NOx
Sea salt aerosols
Biogenic VOCs
Data
Monthly
Data Data Download
Hourly
Code
Code Code Download
References
PHLET-OMI NOx Emission
Introduction
Algorithm
Validation
Download Link
Temporal Range
Spatial Range
References
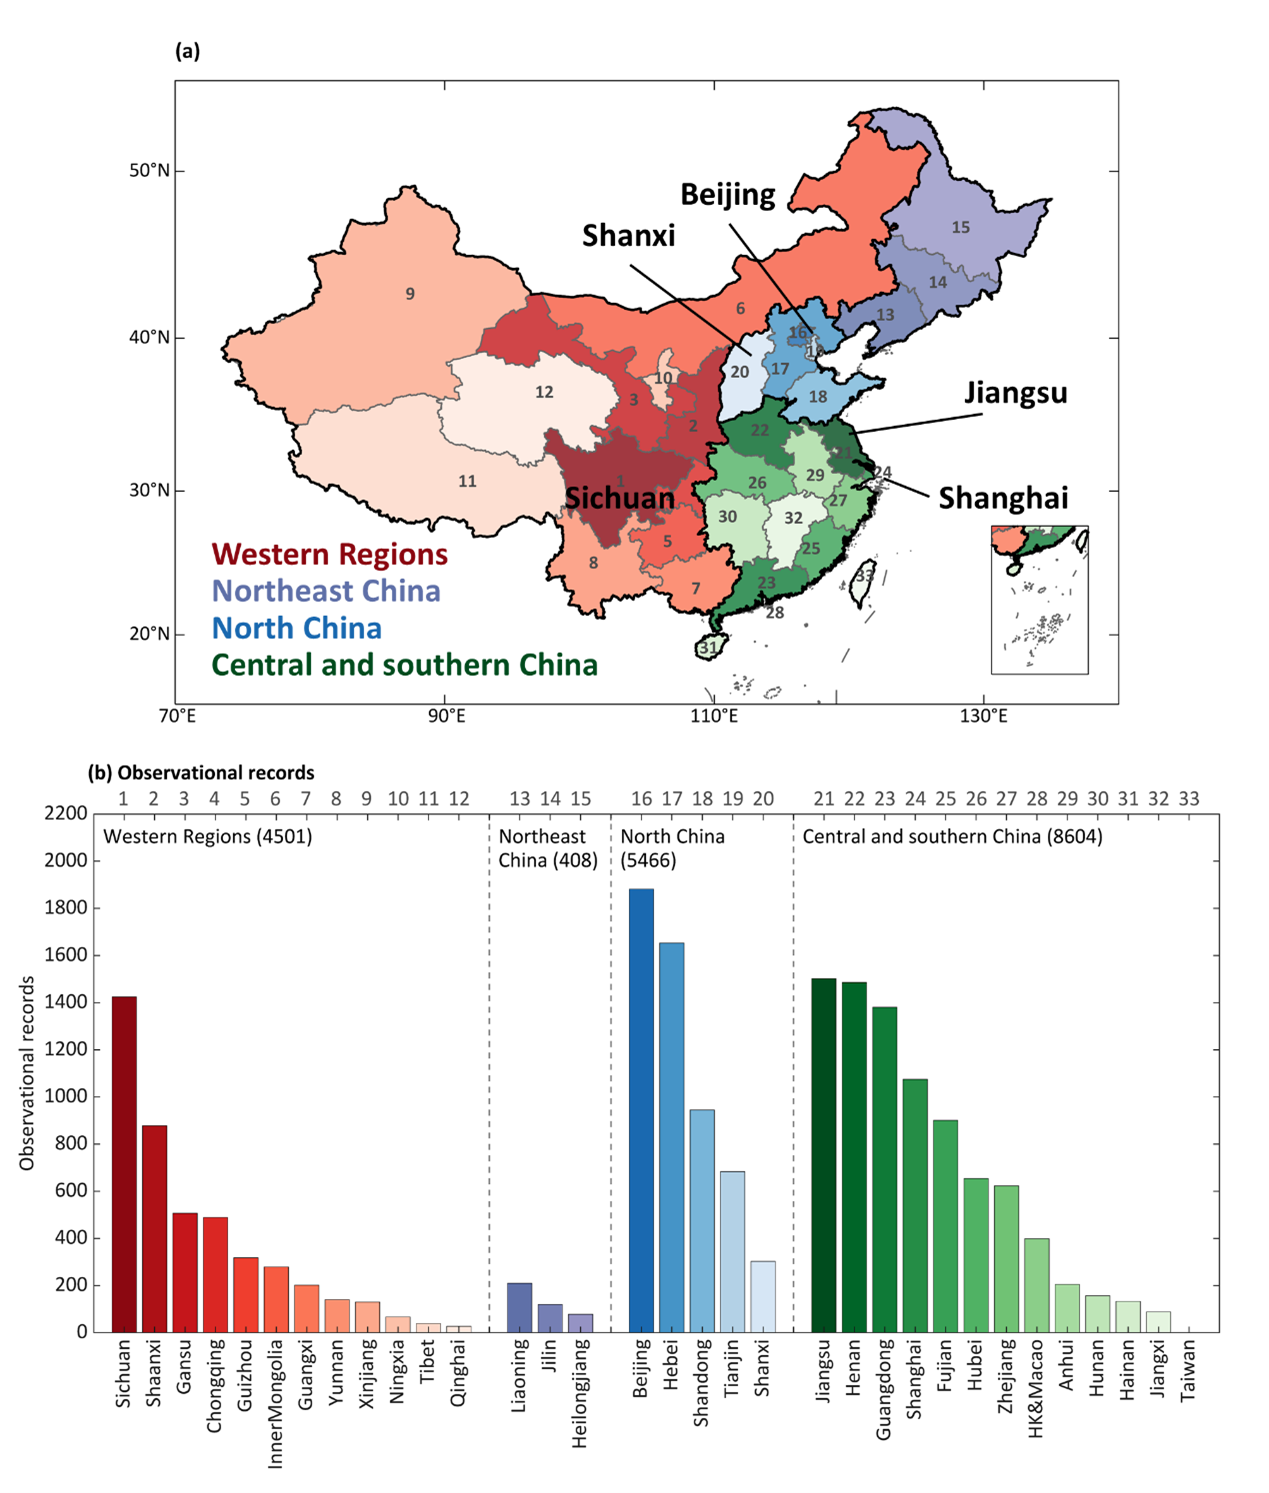
PMCC: A literature-derived long-term observational dataset of PM2.5 components over China
Introduction
Version 1 (2000–2014)
Version 2 (2000–2022)
Keyword
Download Link
Temporal Range
Spatial Range
References
Construction of AOD from visibility
Introduction: Why are visibility data useful for aerosol inference?
Method to converting from station-specific visibility data to gridded AOD data
Product and validation
Data
Data Visibility-model merged monthly mean AOD (Quark mirror)
Data Adjusted visibility-model merged monthly mean AOD (Quark mirror)
References
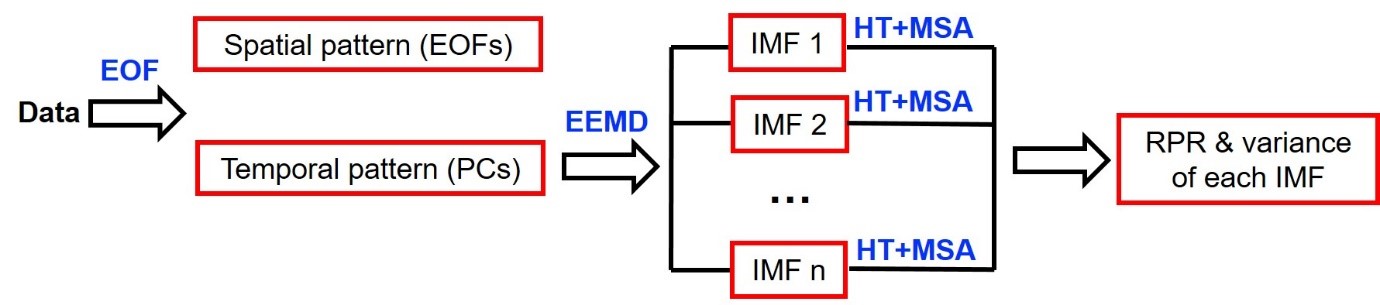
EOF-EEMD: A statistical analysis and visualization package
Introduction
Download EOF-EEMD
References
PKUCPL: A two-Way coupler for model integration
Introduction
- We use CO as a tracer to diagnose the consequence of the two-way coupling (Difference between a two-way coupled and a ‘pure’ global simulation: An animation from 2008.07.01 to 2008.08.15). Compared to a pure global model, the two-way coupled simulation increases the global tropospheric mean CO concentration in 2009 by 10.4%, with a greater enhancement at 13.3% in the Northern Hemisphere. Correspondingly, the global tropospheric mean hydroxyl radical (OH) is reduced by 4.2%, resulting in a 4.2% enhancement in the methyl chloroform lifetime. (See the global budget of tropospheric OH for 2009 here.) The resulting CO and OH contents and MCF lifetime are closer to observation-based estimates.
- Various factors differentiate the two-way coupled model from the global model, including the small-scale variability of NOx, CO and VOC, the resolution- and meteorology-dependent natural emissions, and other nonlinear small-scale processes. See the percentage contributions of individual factors to the difference in January 2009 tropospheric CO between the two-way coupled model and the global model.
- Comparisons with the tropospheric CO measurements over the Pacific Ocean during the HIPPO campaigns (Flight tracks and times) in various seasons between 2009 and 2011 show significant improvements by the two-way coupled simulation on the simulated concentration and spatiotemporal variability of CO. In particular, the two-way coupled simulation captures the measured vertical profiles of CO, with a mean bias of 1.1 ppb (1.4%) below 9 km compared to the bias at -7.2 ppb (-9.2%) for the global model alone. See the CO time-height distribution across five HIPPO campaigns and the CO vertical profiles in five individual HIPPO campaigns.
- The two-way coupling also affects simulations of other species. See our preliminary results for 2009: Global tropospheric hydrophobic BC, Global tropospheric hydrophilic BC, Global tropospheric OH, Global tropospheric O3.
PKUCPL Code applied to GEOS-Chem
PKUCPL for integrating other models
References
Please select language / 请选择语言
Register once with your name and e-mail, then log in to download.
注册一次,之后用姓名和邮箱登录即可下载。
Request data (English)
Downloading data requires a free account. Register once with the basic information below; after that, log in with your name and e-mail and the download starts immediately. Your information is used only for data services and usage statistics.
Signed in as
申请数据(中文)
下载数据需先注册账号:请填写以下基本信息完成注册(仅需一次);之后用姓名和邮箱登录,登录成功后自动开始下载。所填信息仅用于数据服务与使用情况统计。
已登录:
One more step
This file belongs to a data product you did not select when you registered. Tick the product(s) you need — we record the authorisation, then the download continues.